In my previous post, I described a way to think about our internal product communications, and how that can help us optimize our time and make us more effective as Product Managers. The main goal was to show that by thinking about what, when and to whom we need to communicate, we can find different ways to get the message across without spending so much time on it.
This post is about making these ideas concrete through a set of guidelines, templates, and JIRA+Excel tips so you can create effective status and progress reports quickly, have fewer meetings, and get out of the building, which is where you need to be.
Out of the key dimensions (Content / What, Audience / Who, Timing / When and Format / How), the Format is probably the hardest to get right. You may recall this graph showing which formats are more helpful for each type of communication we need to have:

One of the reasons that we as PMs feel like we’re always “deep in the weeds” is that we’re spending way too much time sharing status and progress updates with other teams and stakeholders, most likely in meetings. You’ll notice however that there isn’t much space for meetings in this graph. The reason is simple, when you think about what each type of communication is for:
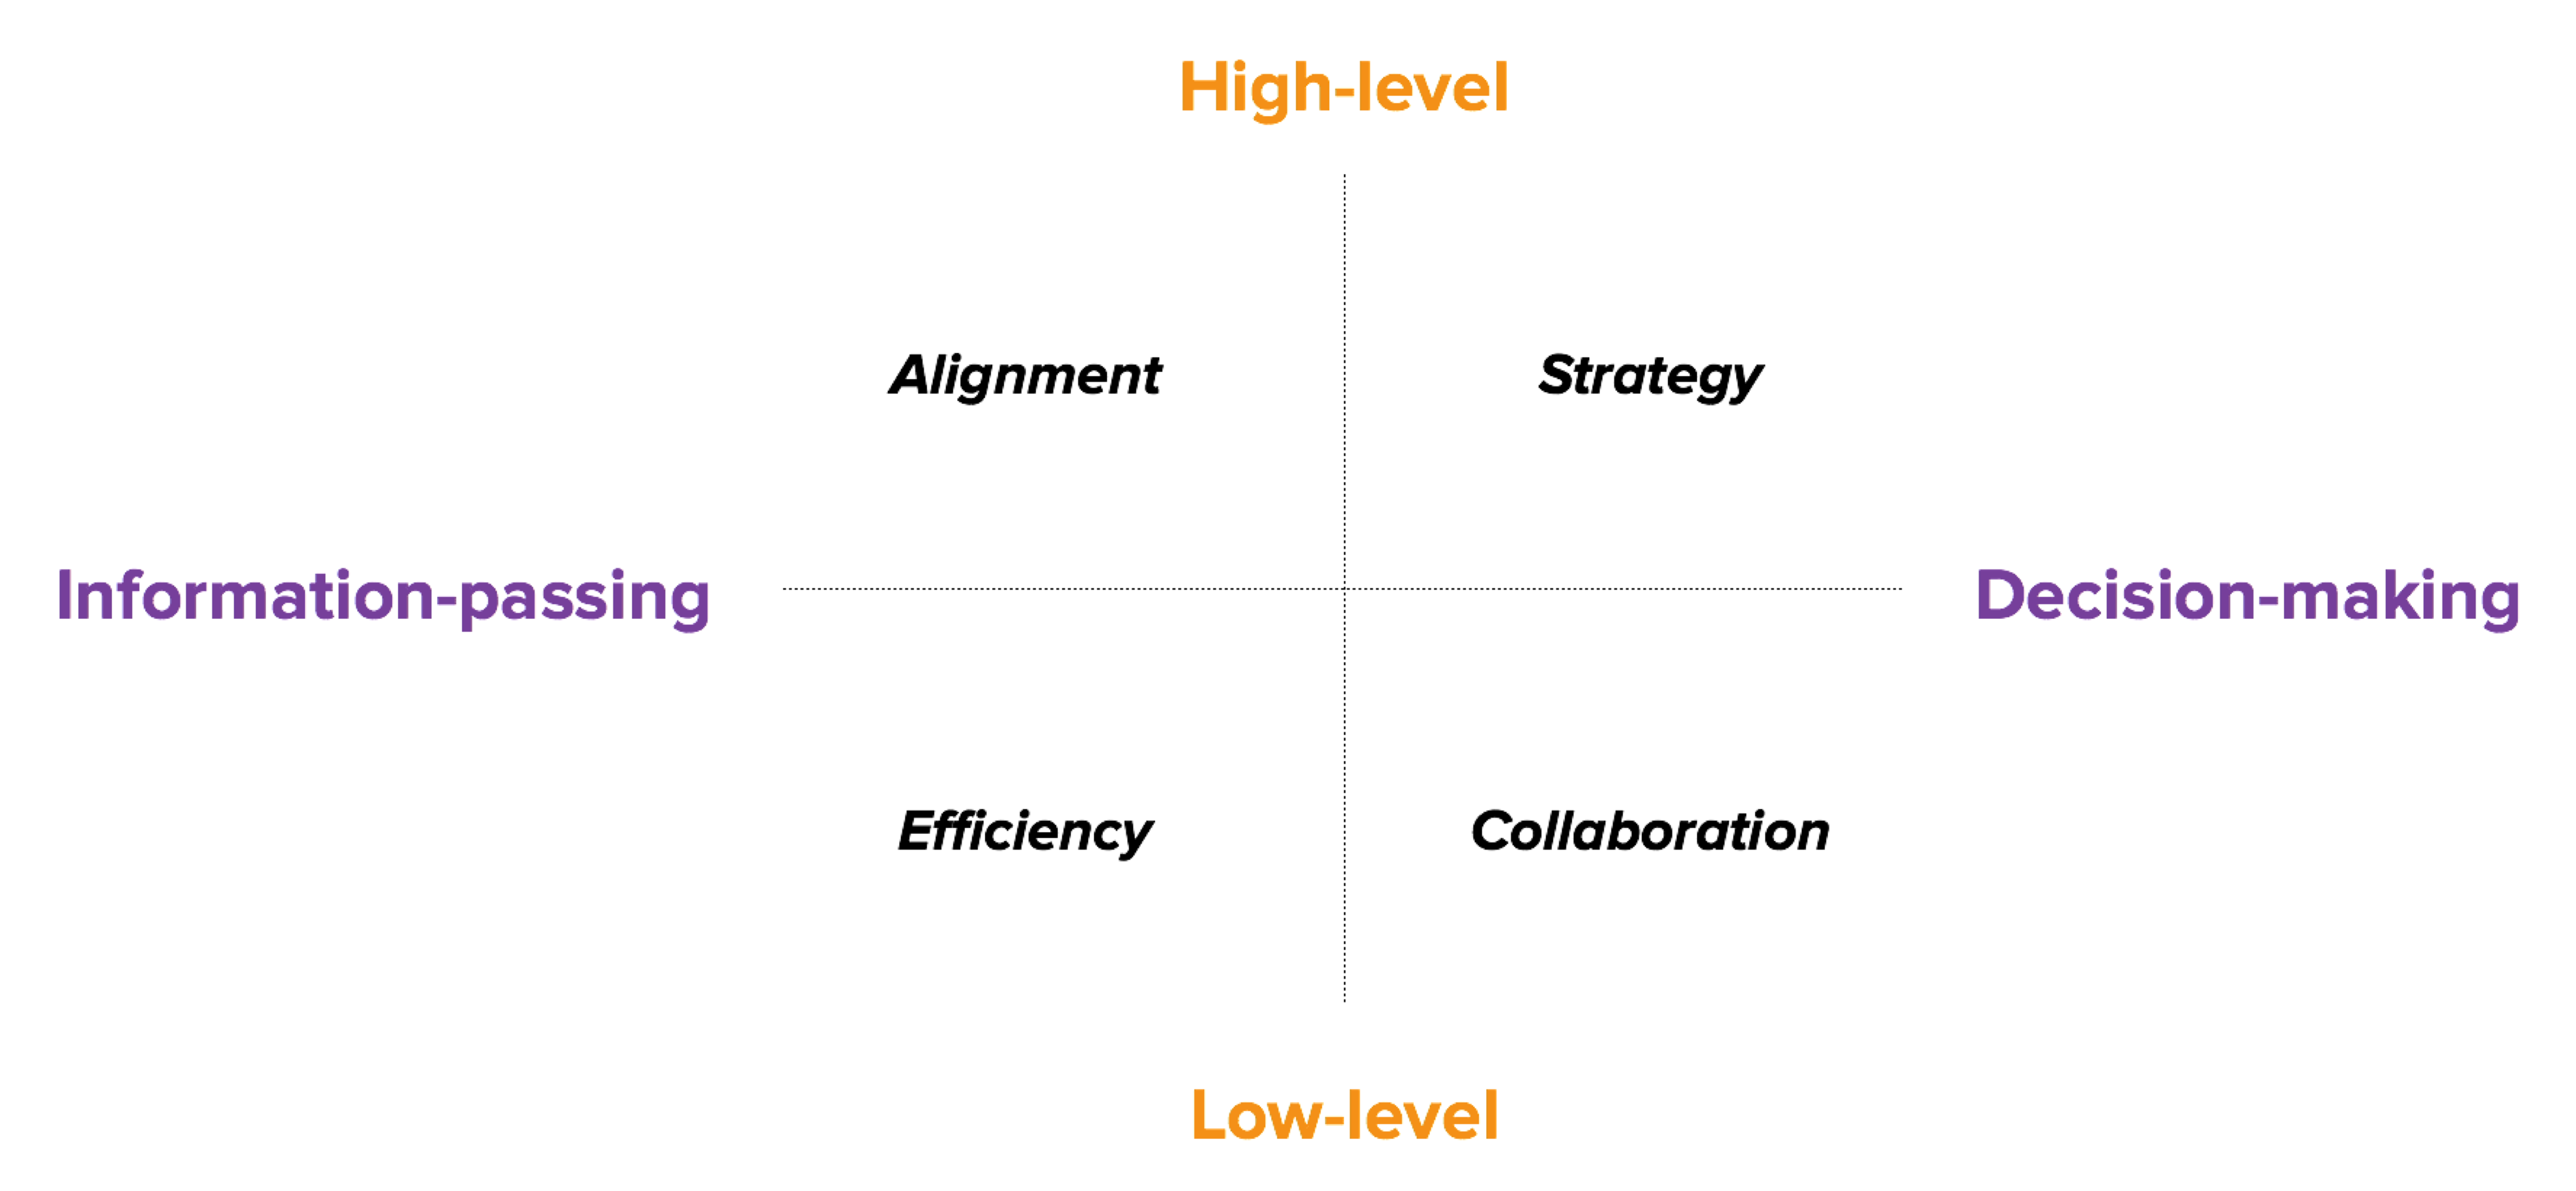
- High-level decision-making is about discussing the big picture, setting our product’s strategy
- Low-level decision-making is about the day-to-day execution, collaborating cross-functionally to build the product
- High-level information-passing is about informing others about our goals’ status and progress, creating alignment
- Low-level information-passing is about keeping other updated about our work in progress and releases, so they’re able to do their jobs with more efficiency
The problem is that the sheer amount of things that happen on the left of the graph (specially on the lower side), easily drives us into being part-time project managers, trying to keep everyone informed about what’s going on. There’s always a lot happening in the recent past and near future of the product. These are some of the biggest areas that stakeholders care about within this space…
Work / Progress
- What are you working on (and why)?
- What progress are you making on X?
- Anything we need to be concerned about?
- What have you worked on recently?
Releases
- When are our next releases happening?
- What progress are you making on them?
- Anything we need to be concerned about?
- What have you released recently?
Goals / KPIs
- What’s the current status of our goal/KPI?
- How is it moving (vs target)?
- Why is it moving like that?
- Anything we should know or think about?
If we plot these on our graph, they’d occupy this space:

All of the questions above are about keeping people updated, but they’re not about discussion. Our goals and work are defined elsewhere, at different times, and there are good tools for that (like face-to face discussions, presentations, and roadmapping, product design and collaboration tools). However, to answer these day-to-day, follow-up type-of-questions, most of us end up scheduling regular status meetings, because “they’re just easier”. I believe this is a waste of everyone’s precious time, and we should save our meeting time for when it’s most effective: when we need to decide things, not when we’re just sharing updates.
Templates and tips for fewer status meetings
One of the main reasons we set up a meeting instead of sharing a report with stakeholders is that our project management tools require some work from us to get the data into a format that’s actually useful to them. Another reason is that people from outside of Tech don’t really like / know / want / remember to go to JIRA and Confluence.
Hence, it’s critical that you choose a communication medium where you know they’ll have easy access to the information. In most places, that’s still email. In others, it might be Slack, or a shared document/wiki page with a simple format that people know how to get to (and that you regularly remind me them to have a look). We have to regularly reach stakeholders where they are, and make it extremely easy for them (not us) to consume the information.
Let’s now go over some report templates that I’ve found effective in addressing the questions above, along with some JIRA+Excel tips, that should help you get them ready more quickly. This post focuses on the Progress and Releases side of things because they share the same source and their reports can be produced in similar ways. Goals/KPIs will have to wait for a future post.
Click here to download the spreadsheet and follow along the examples (by the way: it’s built with a more limited Excel feature set because I’m on a Mac — if you’re on Windows, you could play with other PivotTable features like Timelines).
Work
There are two common views that stakeholders need into our work: the progress or status of what we’re currently doing, and what we’ve recently completed. Remember the timeframe we’re addressing here: present, recent past and near future. Discussions about the future—that is, what should get higher priority in the roadmap and backlog need to be separate, and a good use of meetings and presentations—as they’re related to the product’s strategy.
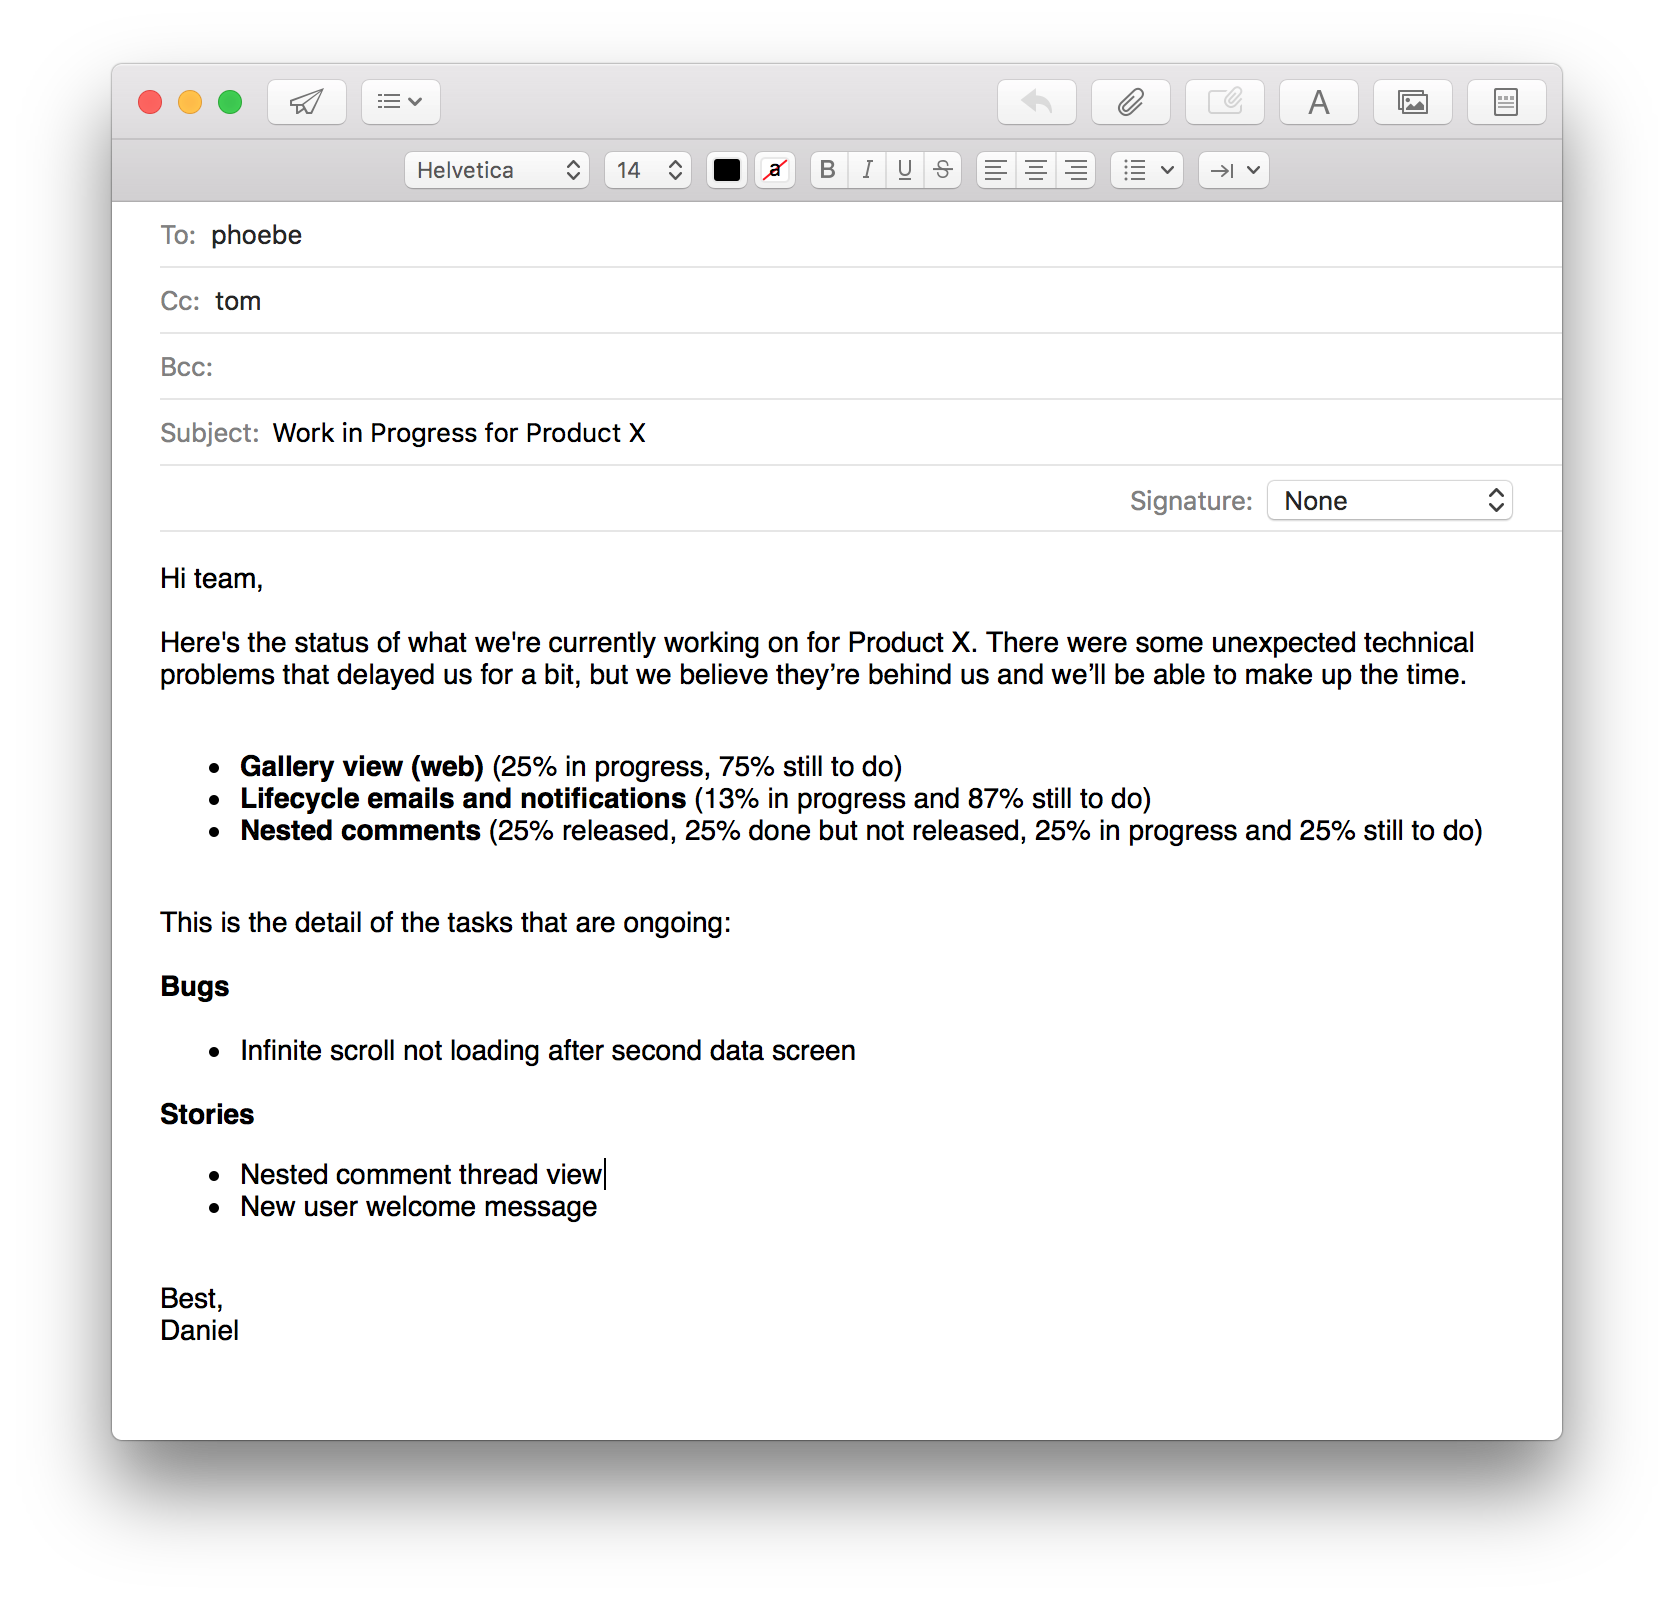
Progress / Status
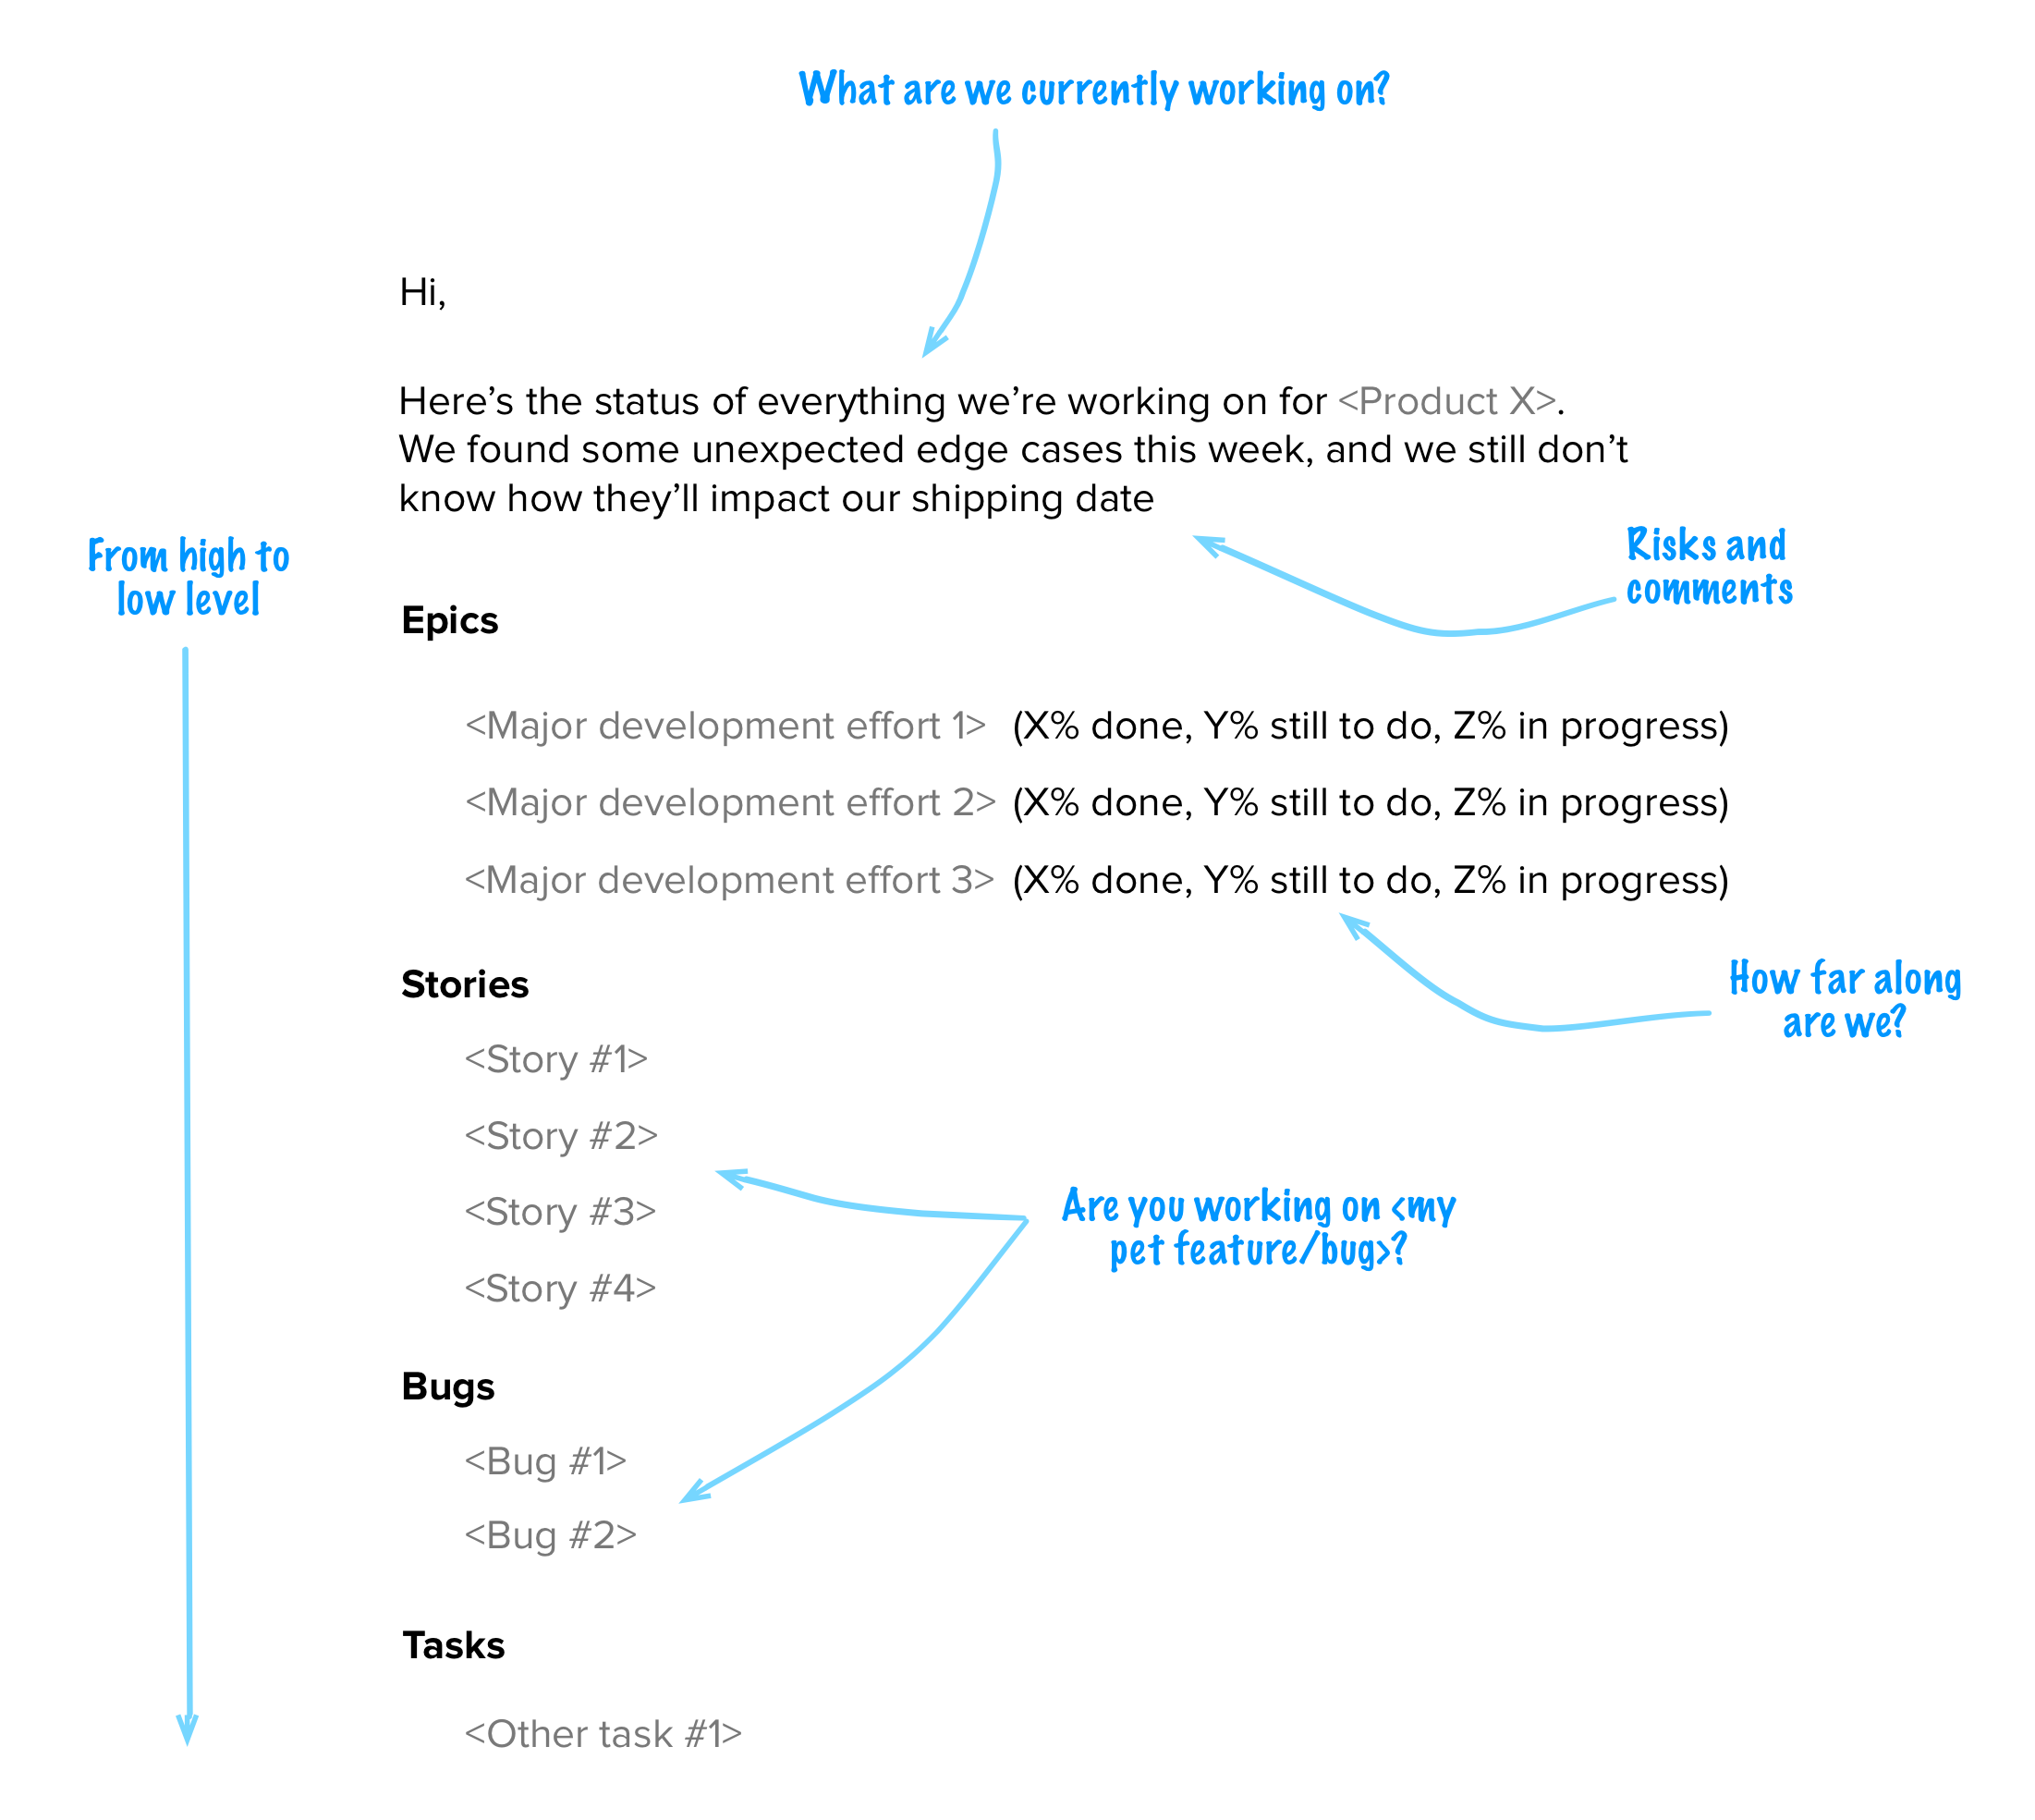
To some, this is represented by the progress we’re making on an Epic, low-level tasks that are in progress. This report template addresses these views and common questions around them:
How to create this with JIRA and Excel
In your JIRA project, select “All Issues” and make sure that all issues from any status are displayed, and that the first few columns are in this order (the Excel spreadsheet assumes they’ll be in those positions, but you can later customize the filter and spreadsheet):

The reason to include all issues in any status is that you can still easily filter them out in Excel, whilst making it easier to calculate an Epic’s progress based on its composing issues’ statuses. Save this filter so you don’t have to do this again later and export the results in CSV format.

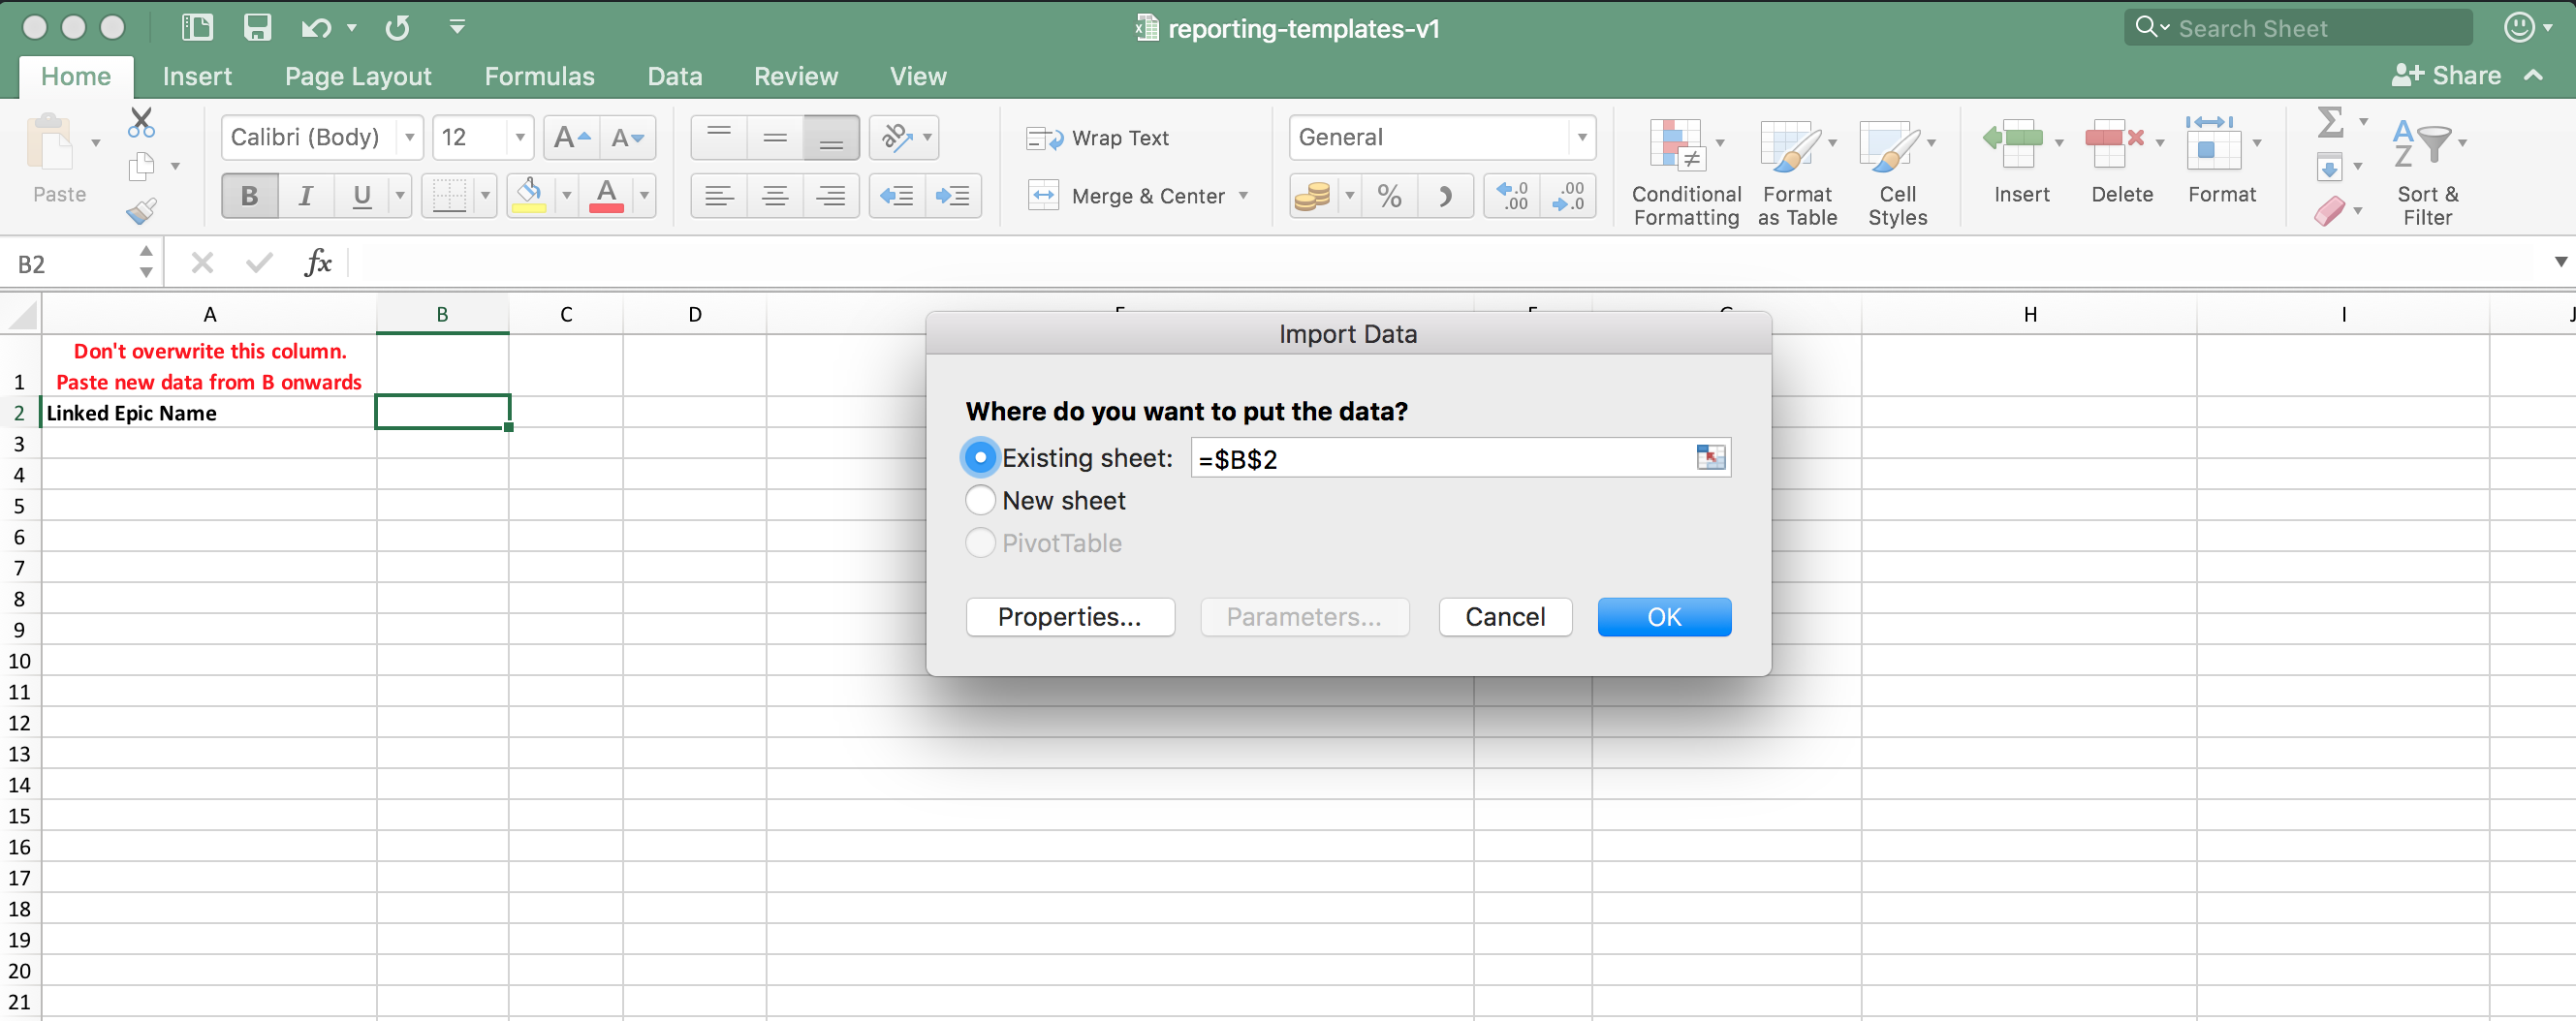
Clear the contents of the Issues tab in this spreadsheet (starting from column B, because A is reserved for a formula that helps us out later), and import the CSV.
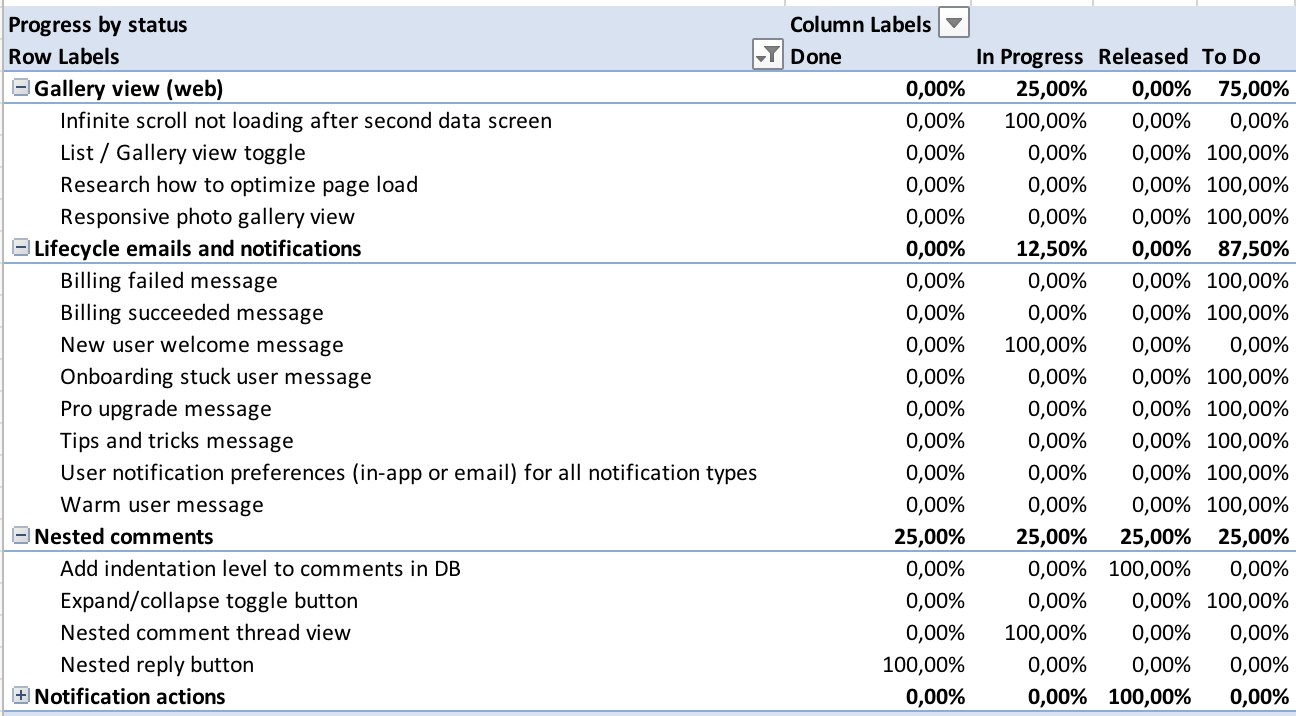
Now, go into the “Progress - Epics” tab and refresh the pivot table. You’ll have a list of all epics, showing their % progress by status: i.e., the % “To Do”, “In Progress”, “Done” or any custom statuses you may have.
For people that need more details about lower-level tasks, go into the “Progress - By type” tab. It groups tasks by type, which you can then filter by whichever statuses that mean “In Progress” to you.

You can now easily filter to select the currently ongoing Epics, add lower level tasks if you need to, and paste them into an email or Slack message that you share with your stakeholders. With some tweaks, it’s easy to reproduce the format of the template that we started from.
Pro-tip: you can set up a personal subscription to the JIRA filter, so that you get its results emailed to you (as described here). You’ll still need to go into JIRA to get the CSV version, but it works as a scheduled reminder for you to send the report out 😉
(You could also subscribe a group of JIRA users and have them receive the search results themselves, but as you’ll see, the format is just terrible for communicating with non-technical people and it requires that all of them have JIRA licenses.)
Recently completed work
Sometimes, we just need to report back on what we’ve been up to. We need to inform what happened over a past period and add more context to explain if/why we over/underperformed (according to previous plans).
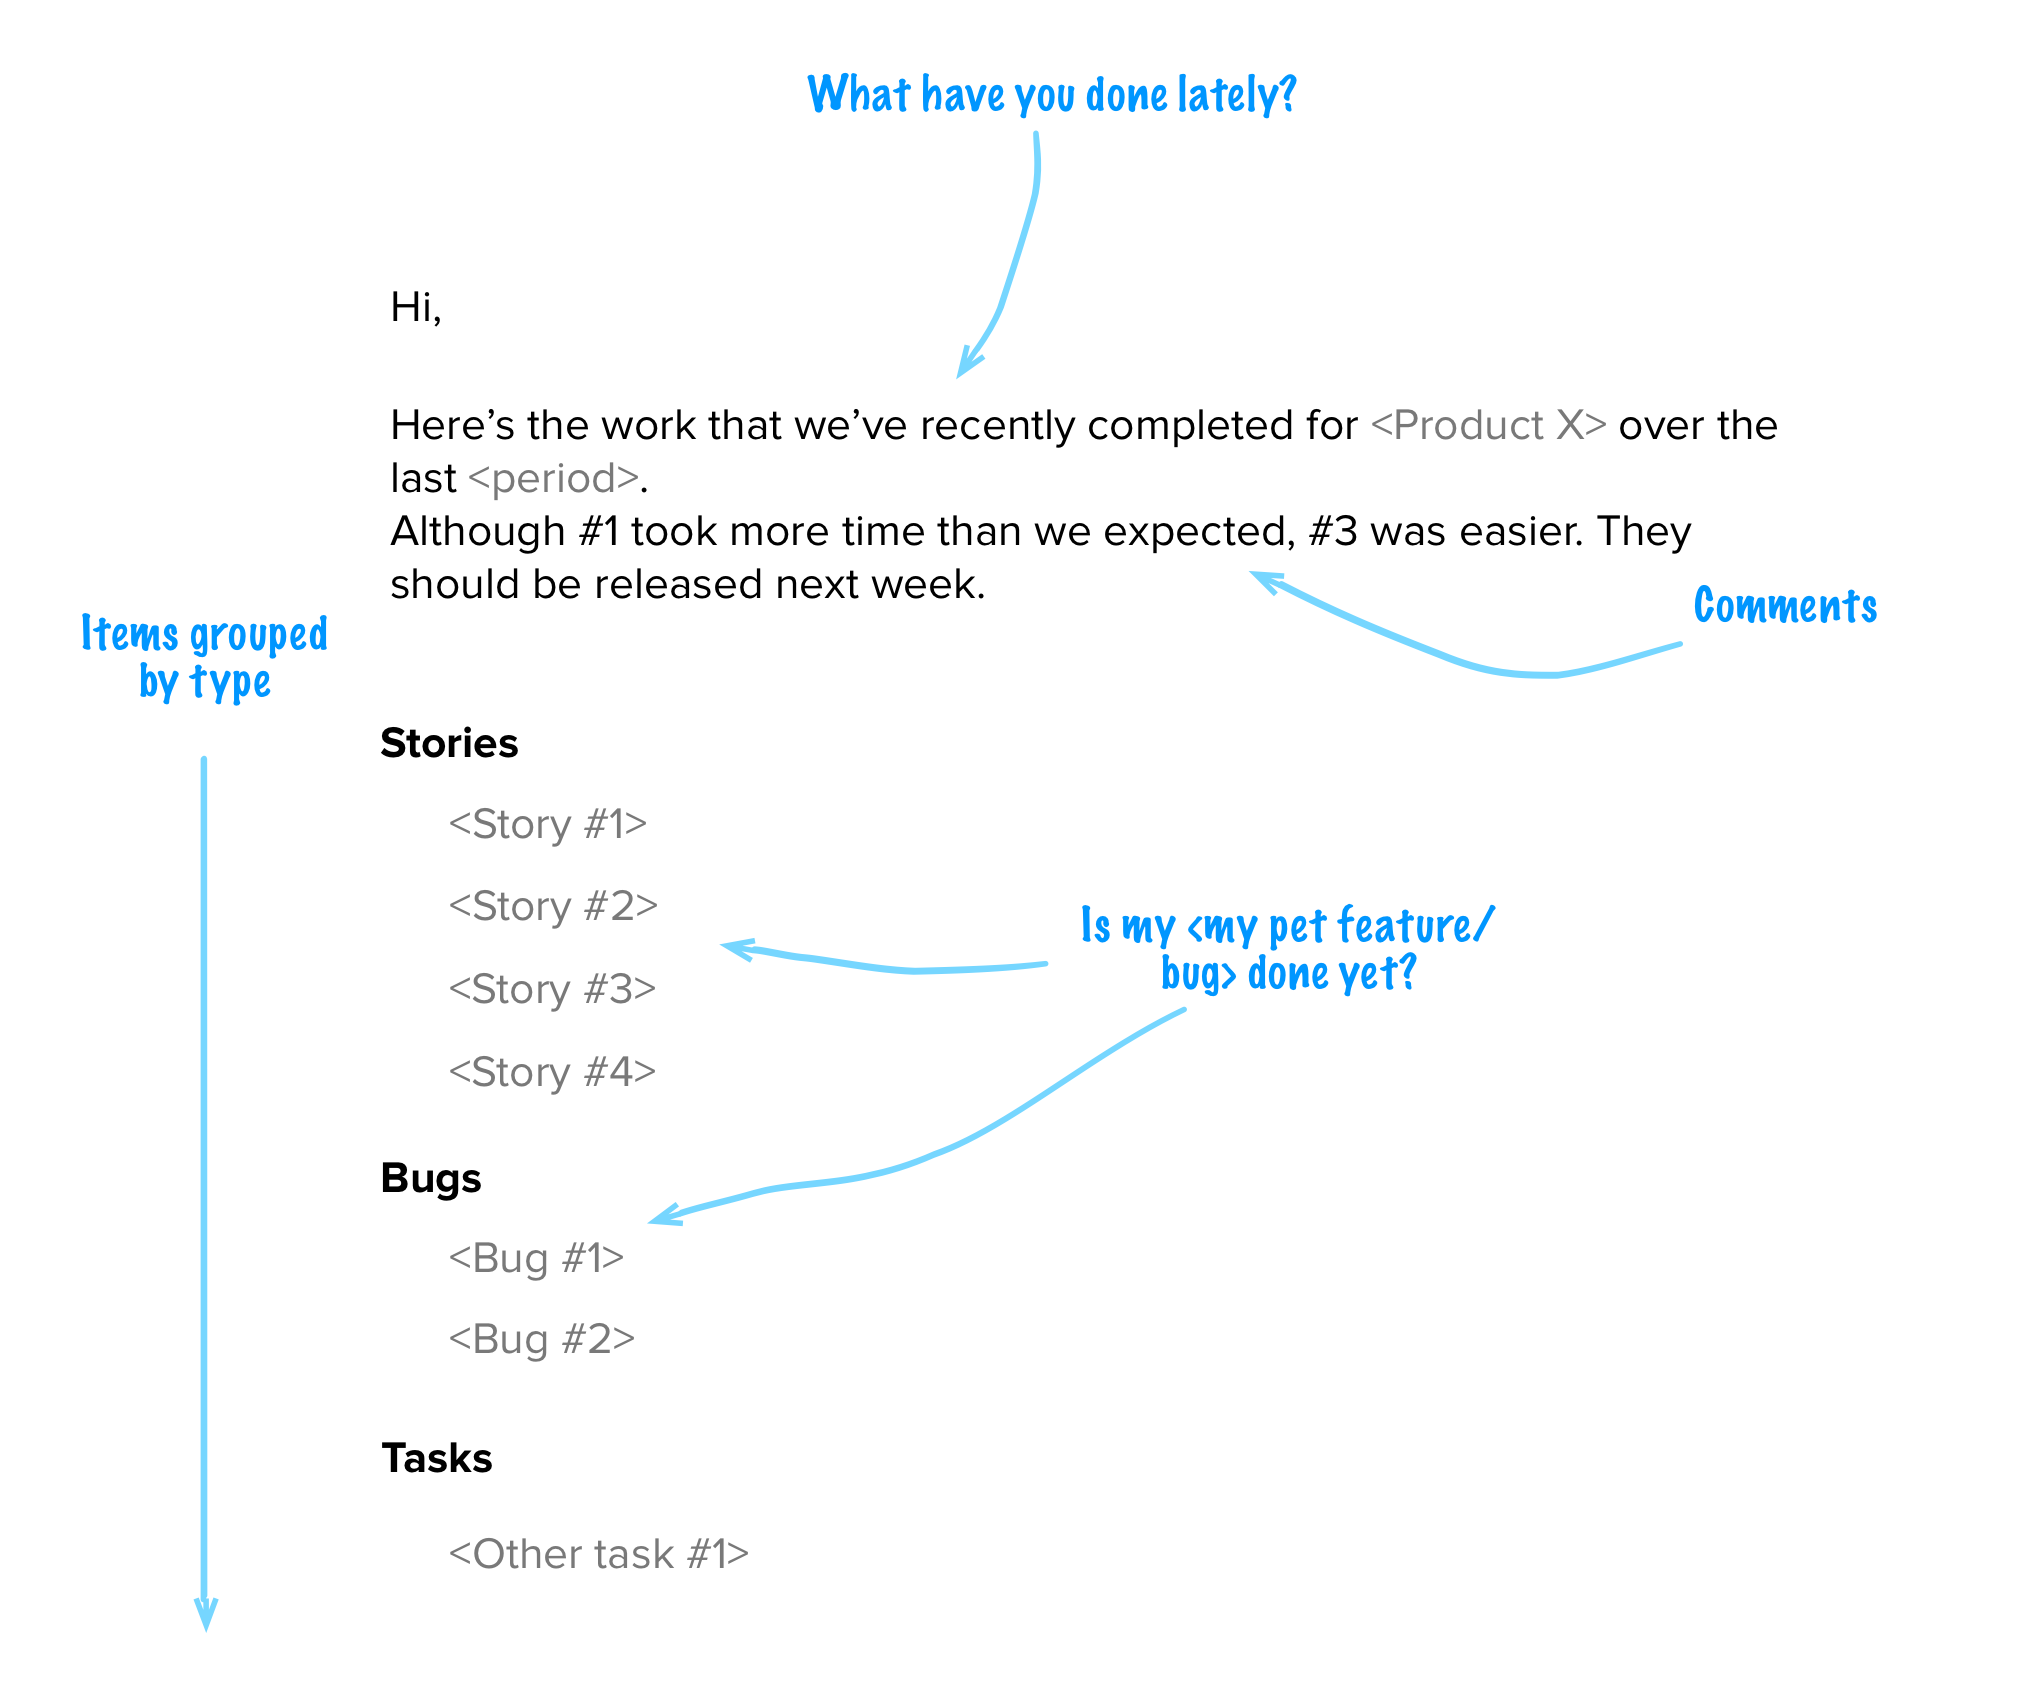
How to create this with JIRA and Excel
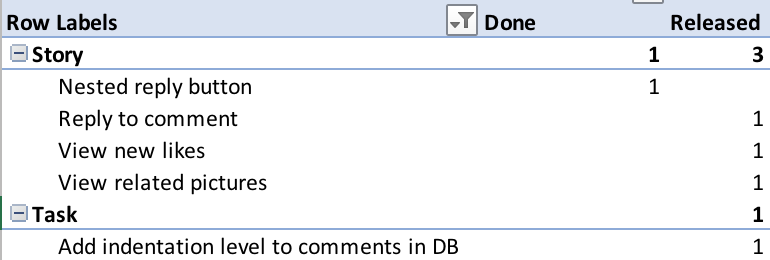
The base for this report is in the “Recently completed” tab. Select the issue types that represent “Done” for you, and filter by resolution date, showing only what’s been resolved after the last time you sent the report. This assumes that your JIRA configuration sets a Resolution date on the issues that are ‘done’. You could also filter by Last Updated date for all your ‘done’ issues.
Releases
Recent and Upcoming
The template for recent and upcoming releases is essentially the same, but what changes is the point of reference. Some people need to know what’s coming up or as soon as something was released, while others only need to stay tuned to “what’s been going on”. This template addresses all of the most common questions around your releases.
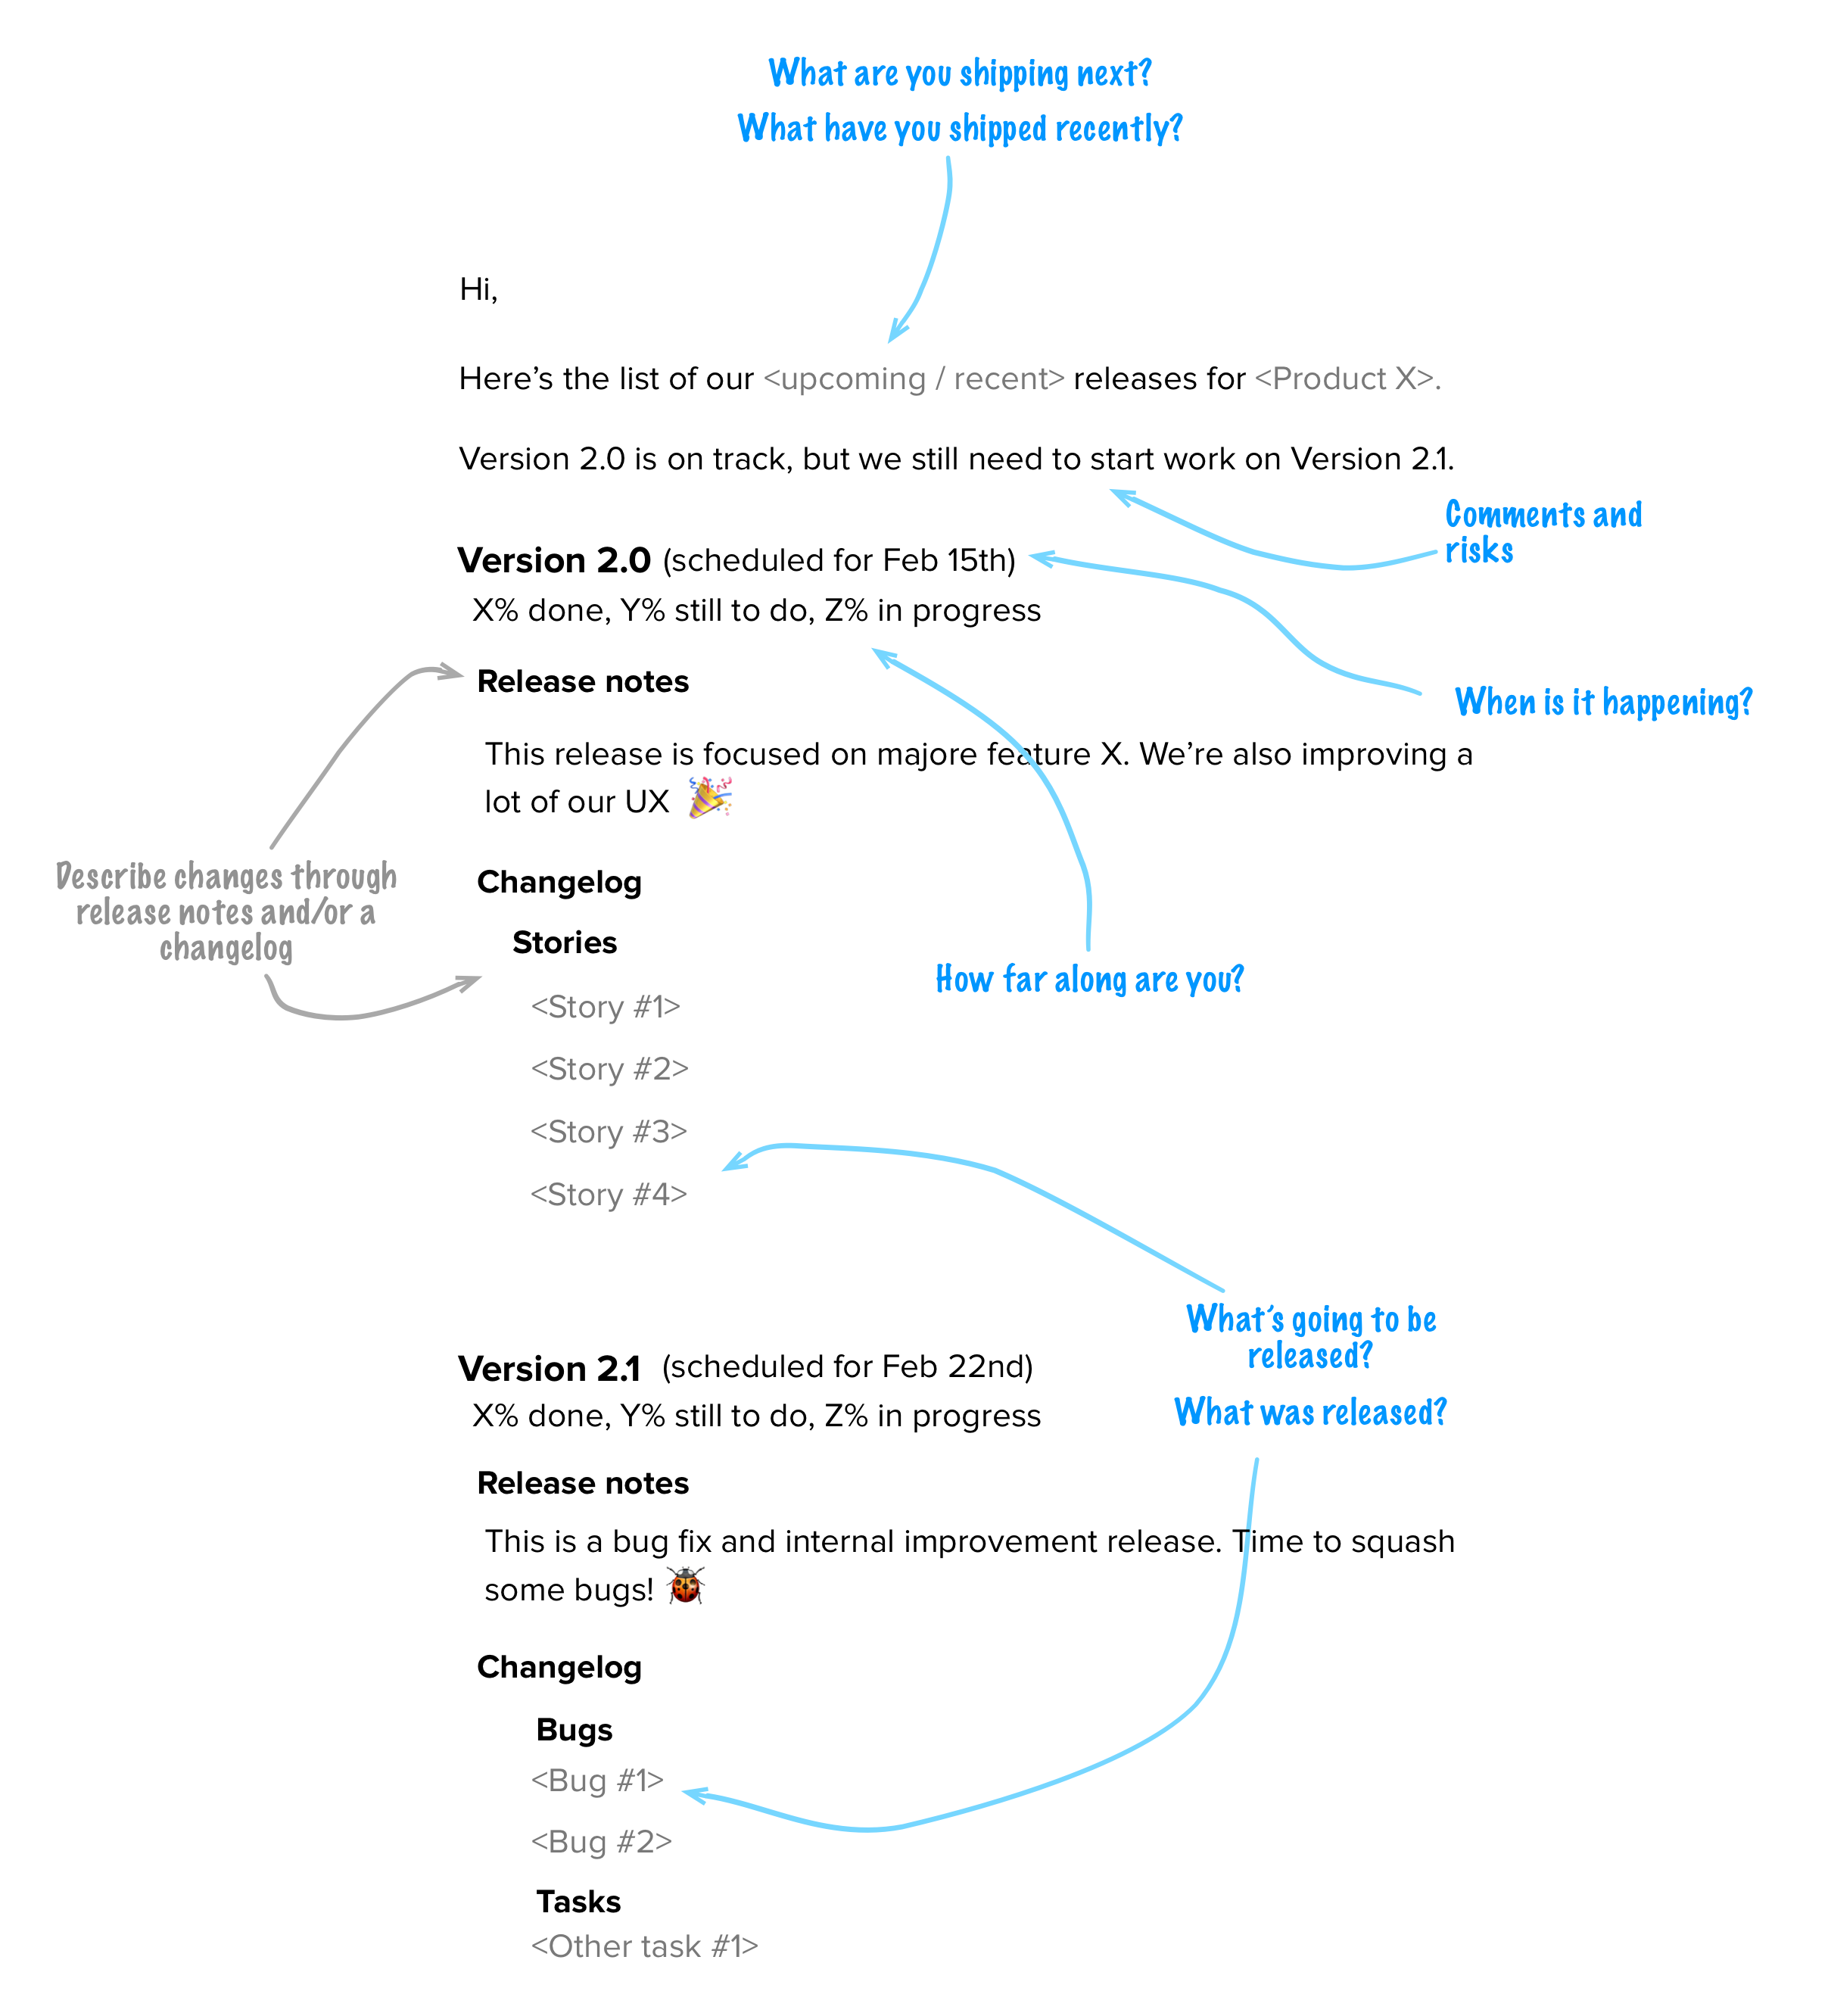
Note that the “changes” section of the template refers to “release notes” and/or the “changelog”. Ideally, what you share with your stakeholders are easy to read, non-technical and engaging release notes with what most care about: the main changes and benefits from this release. The full list of issues that were part of the release (the changelog) are useful to certain stakeholders that need those types of details. Since the process below already produces a changelog grouped by issue type, to make it more readable, you should now have the time to create proper release notes 😉
How to create this with JIRA and Excel
Getting this out of JIRA is not as simple. Ideally, we’d be able to get the releases’ dates from the same issue search we did before, but that’s not possible, as far as I know. I haven’t found a better way to do this, so there’s a bit more manual work when creating these reports. Anyways, if you go into the “Reports” tab in the spreadsheet, you’ll get a list of all releases that are linked with issues in JIRA.
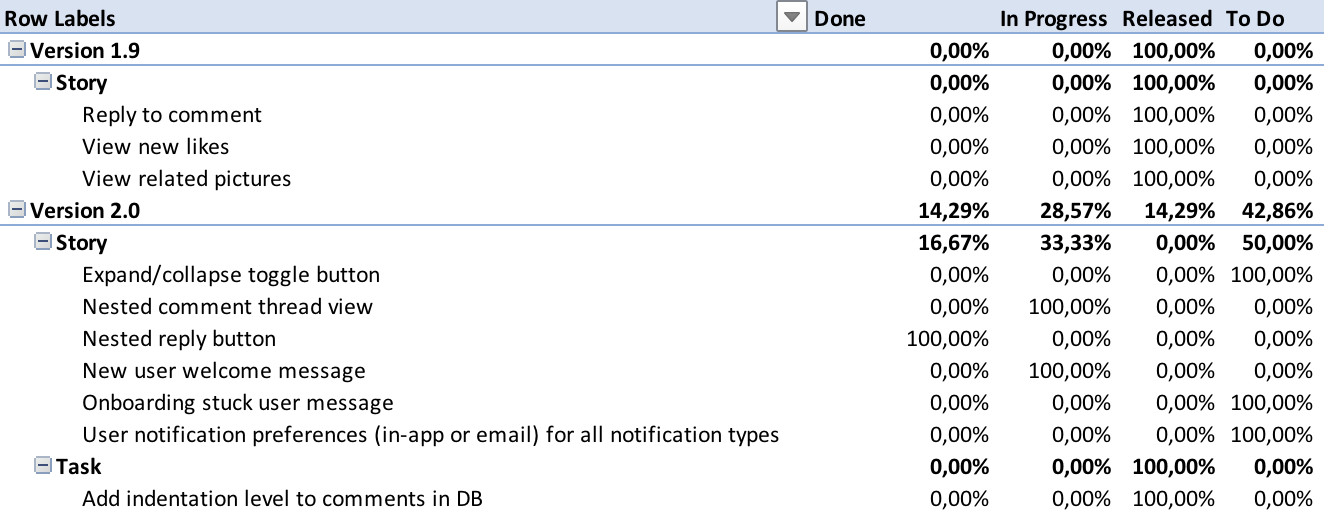
This lets us group them by release and issue type, creating a neat changelog. You could also get this from JIRA’s “Changelog” feature in the release page, but this way is faster and it comes from the same file you’re using for the other reports.
From this list, you would then need to choose the releases that you want people to know about (either upcoming or recent) and manually add their date (by looking at JIRA or your own memory).